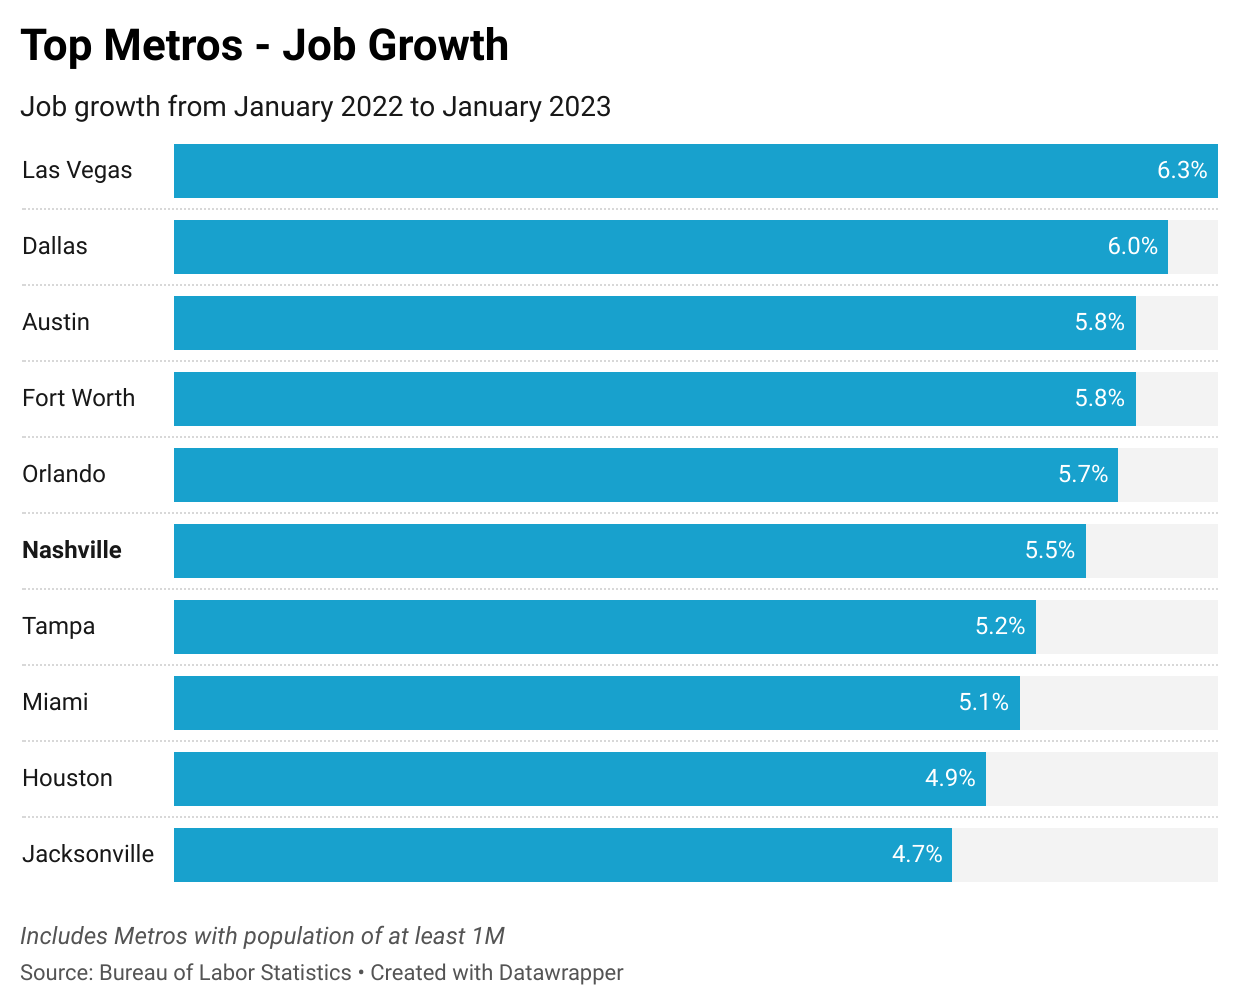
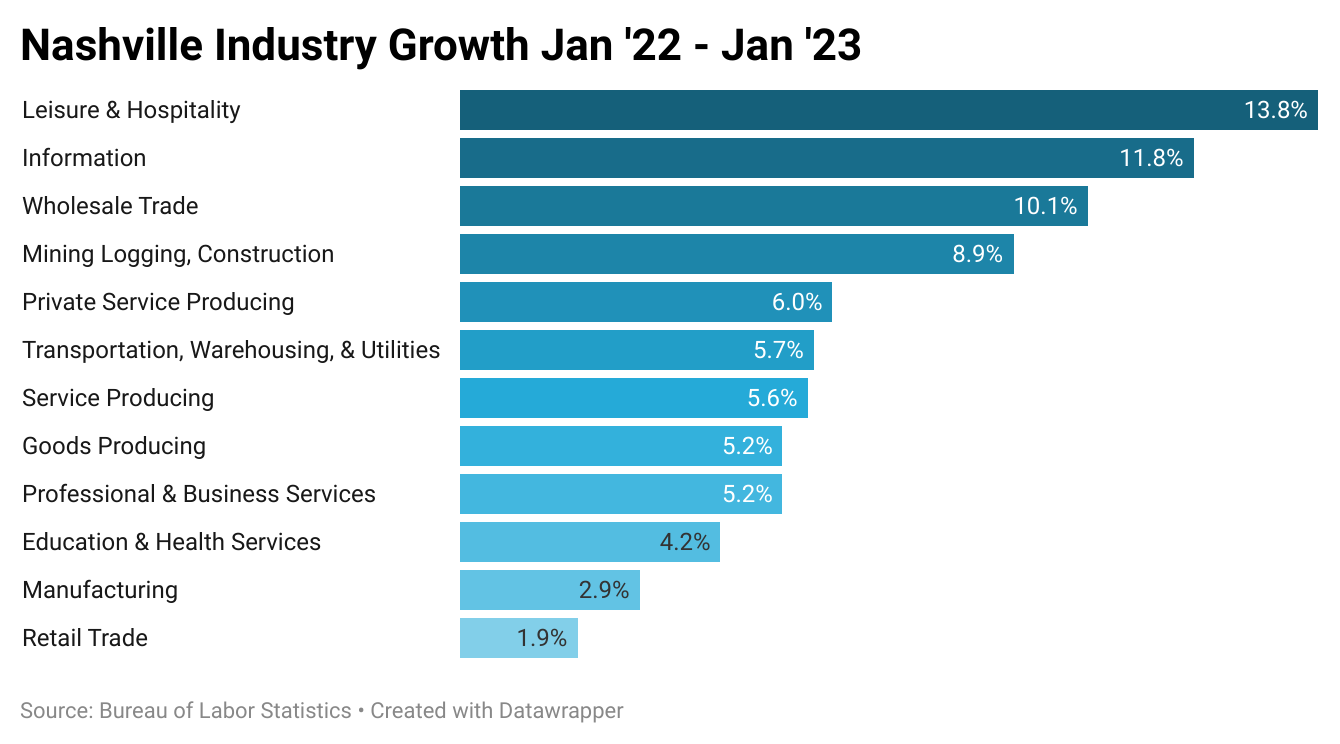
The Bureau of Labor Statistics (BLS) released its metro jobs data last week for the month of January. Nashville had the 6th highest growth rate from a year ago. The Nashville economy continues its strong growth. The different sectors of the economy continue to grow with 3 industries (Leisure and Hospitality, Information, & Wholesale Trade) experiencing double digit growth.
Chart 1
While worries of a recession and economic downturn are top-of-mind for many Americans, Nashville continues to see robust job growth across all sectors with the Leisure & Hospitality, Information, and Wholesale Trade industries showing double-digit growth. The Nashville economy is diverse and strong, making it resilient to broader economic conditions.
Chart 2
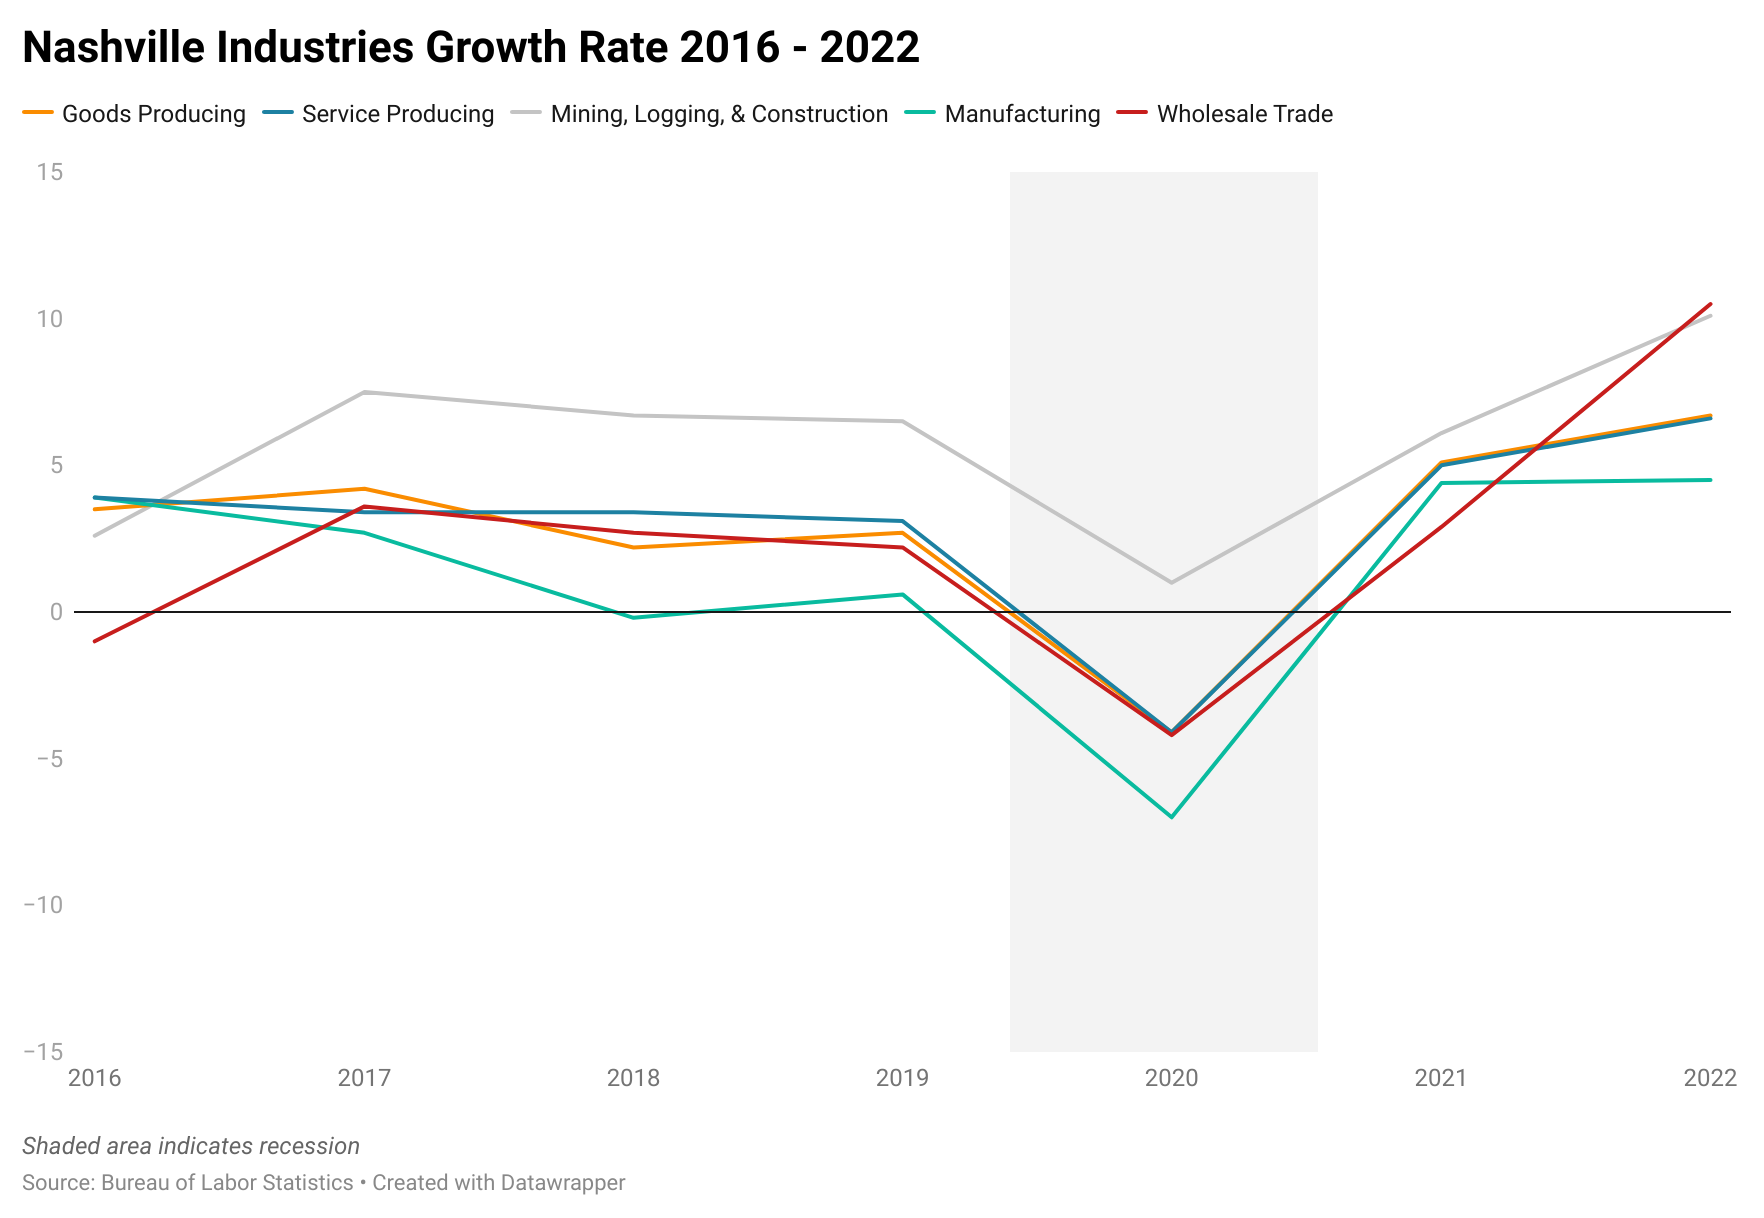
Like everywhere else in the country, Nashville’s economy was hit hard by the pandemic, especially the hospitality and tourism industry. The sector lost almost 20% of its jobs in 2020, but has since recovered and has seen double digit growth in 2021 and 2022, showing that the demand in Music City is stronger than ever. The information sector has also seen tremendous growth, increasing 45% from 2016 to 2022.
Chart 3
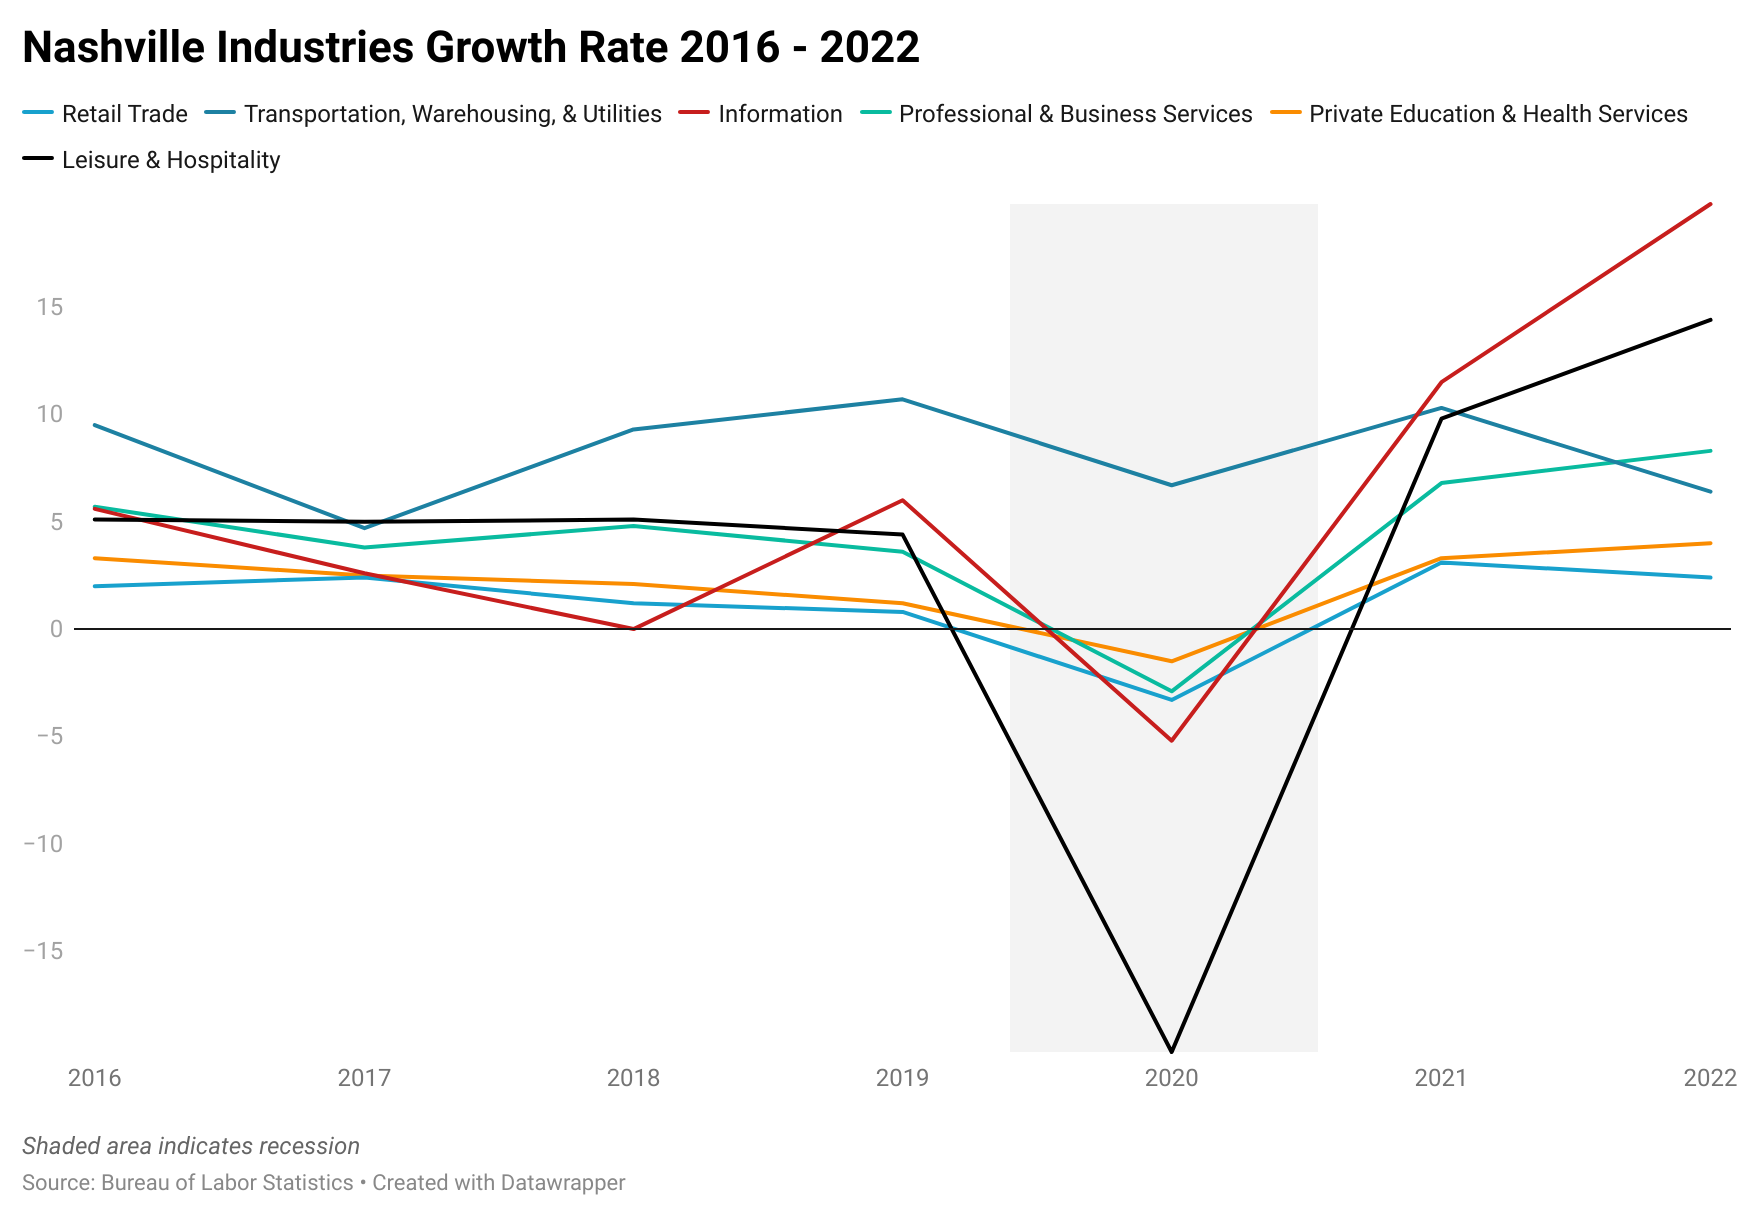
Chart 4